
Agent 09
InsightStreamYour learning, on a control chart
The statistics the platform teaches, applied to your own scores: an individuals chart of quiz results, a Pareto of weak modules, and a projected certification date.
The shape of what InsightStream hands back, drawn live.
In the product
What InsightStream looks like when you open it
This is the screen itself, captured from the running product on a demo company. Nothing in it was drawn for the website.
Opens at /insights once you are signed in.
- A control chart of your scores
- A Pareto of weak modules
- A projected certification date
sigmaforge.ai/insights

Works at the track stage
Something small in, a result you keep
Everything it returns can be saved into the project it belongs to, beside the rest of the work.
What it takes in
- Your quiz and exam scores
- Section completion times
What you get back
- A control chart of your scores
- A Pareto of weak modules
- A projected certification date
More of the screen
InsightStream, a step further in
- sigmaforge.ai/insights
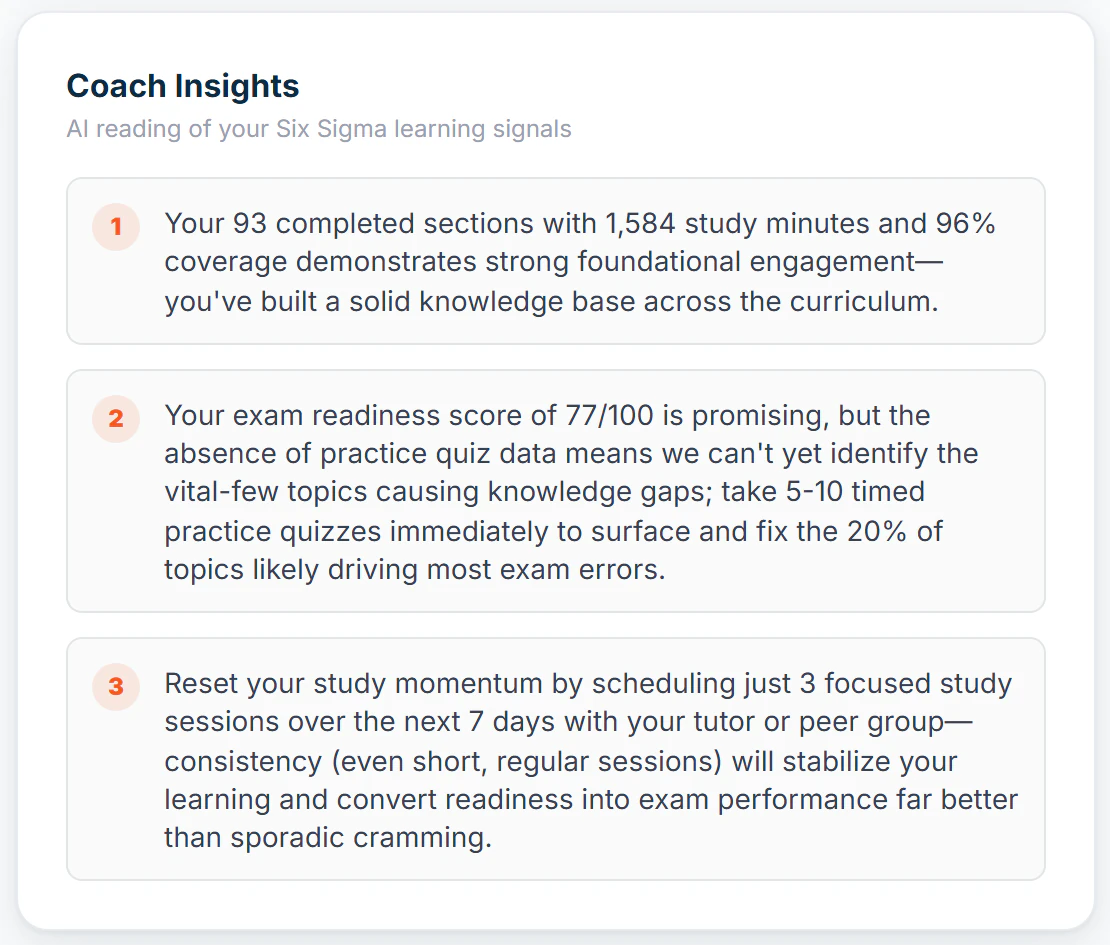
Product screen, demo data InsightStream coach insights: three numbered readings of a learner’s study signals, each with a specific next step.

All thirteen
The other 12
Each one does one job, and every one has a screen you open.
- Agent 01DataForgeStatistics you can defend
- Agent 02DocuForgeFrom a short brief to a finished document
- Agent 03ProjectSenseiA coach for every phase
- Agent 04ImpactMatrixPut a number on it
- Agent 05SigmaTutorAsk the course anything
- Agent 06PathForgeYour next step, worked out for you
- Agent 07CertiAIPractice before it counts
- Agent 08FocusBotKeeps you moving
- Agent 11SigmaHubFinds the passage the answer comes from
- Agent 10TeachPilotReports on a whole cohort
- Agent 12ClarityAISays it again in plain language
- Agent 13CollabForgeWrites the retrospective from what happened
InsightStream on your work
See InsightStream on one of your own processes
Thirty minutes, one of your processes, and whichever agents the work calls for. You leave with what they produced.